Stablecoin dollars move 33 times a month but pay once in five months
Raw chain data says stablecoins are racing around. Strip out bots and exchanges and each dollar pays for something about once every five months, though that rate is rising fast.
There are three honest answers to the question of how fast stablecoin money moves, and they are far apart.
Count every transfer on the chain and the answer is fast. In the 30 days to 9 November, the Visa Onchain Analytics Dashboard, built with the data firm Allium, recorded $9.6 trillion of stablecoin transactions.Visa Onchain Analytics Dashboard data (Allium), read 9 November 2026. Stablecoin supply on DefiLlama stood at $293.0 billion that day, so by our calculation each dollar changed hands about 33 times a month.S-Curve calculation from Visa/Allium and DefiLlama data; DefiLlama stablecoin supply data.
Filter out exchanges, bots, bridges and other machine traffic and the same dashboard’s adjusted volume was $351.1 billion, about once a month per dollar. Count only what Allium labels as payments and, in October, each dollar of supply paid for something about once every five months.
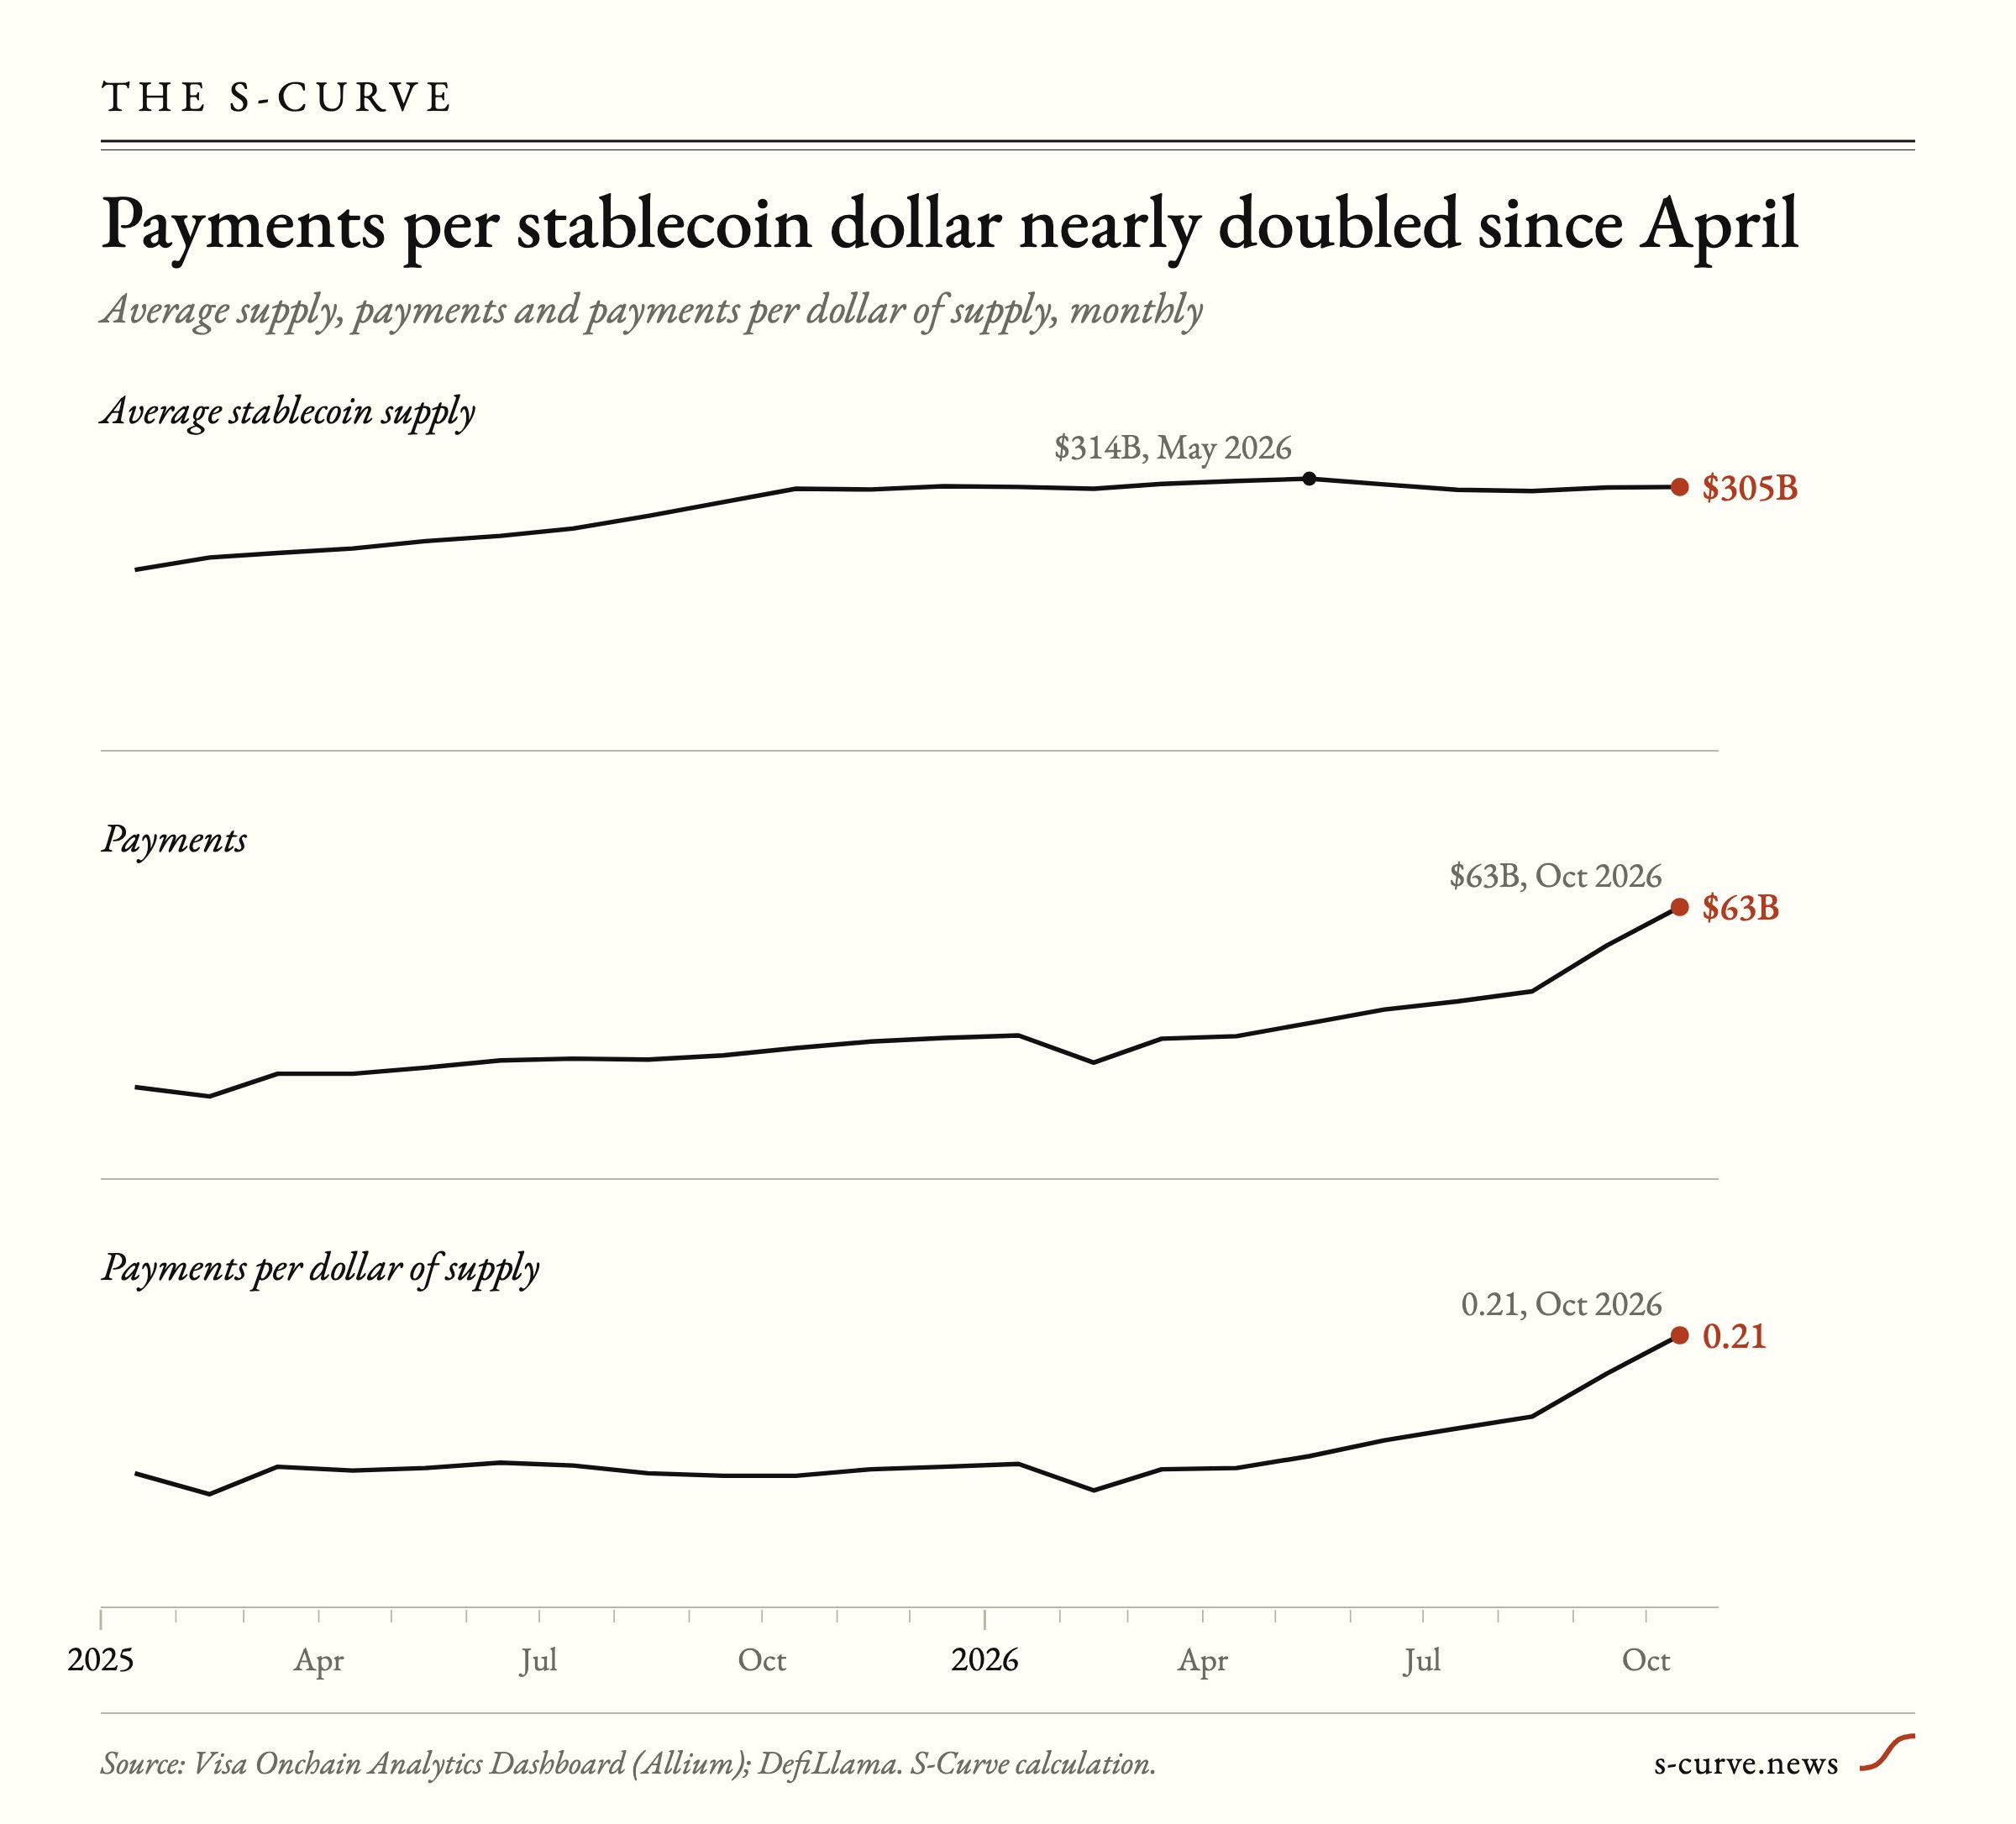
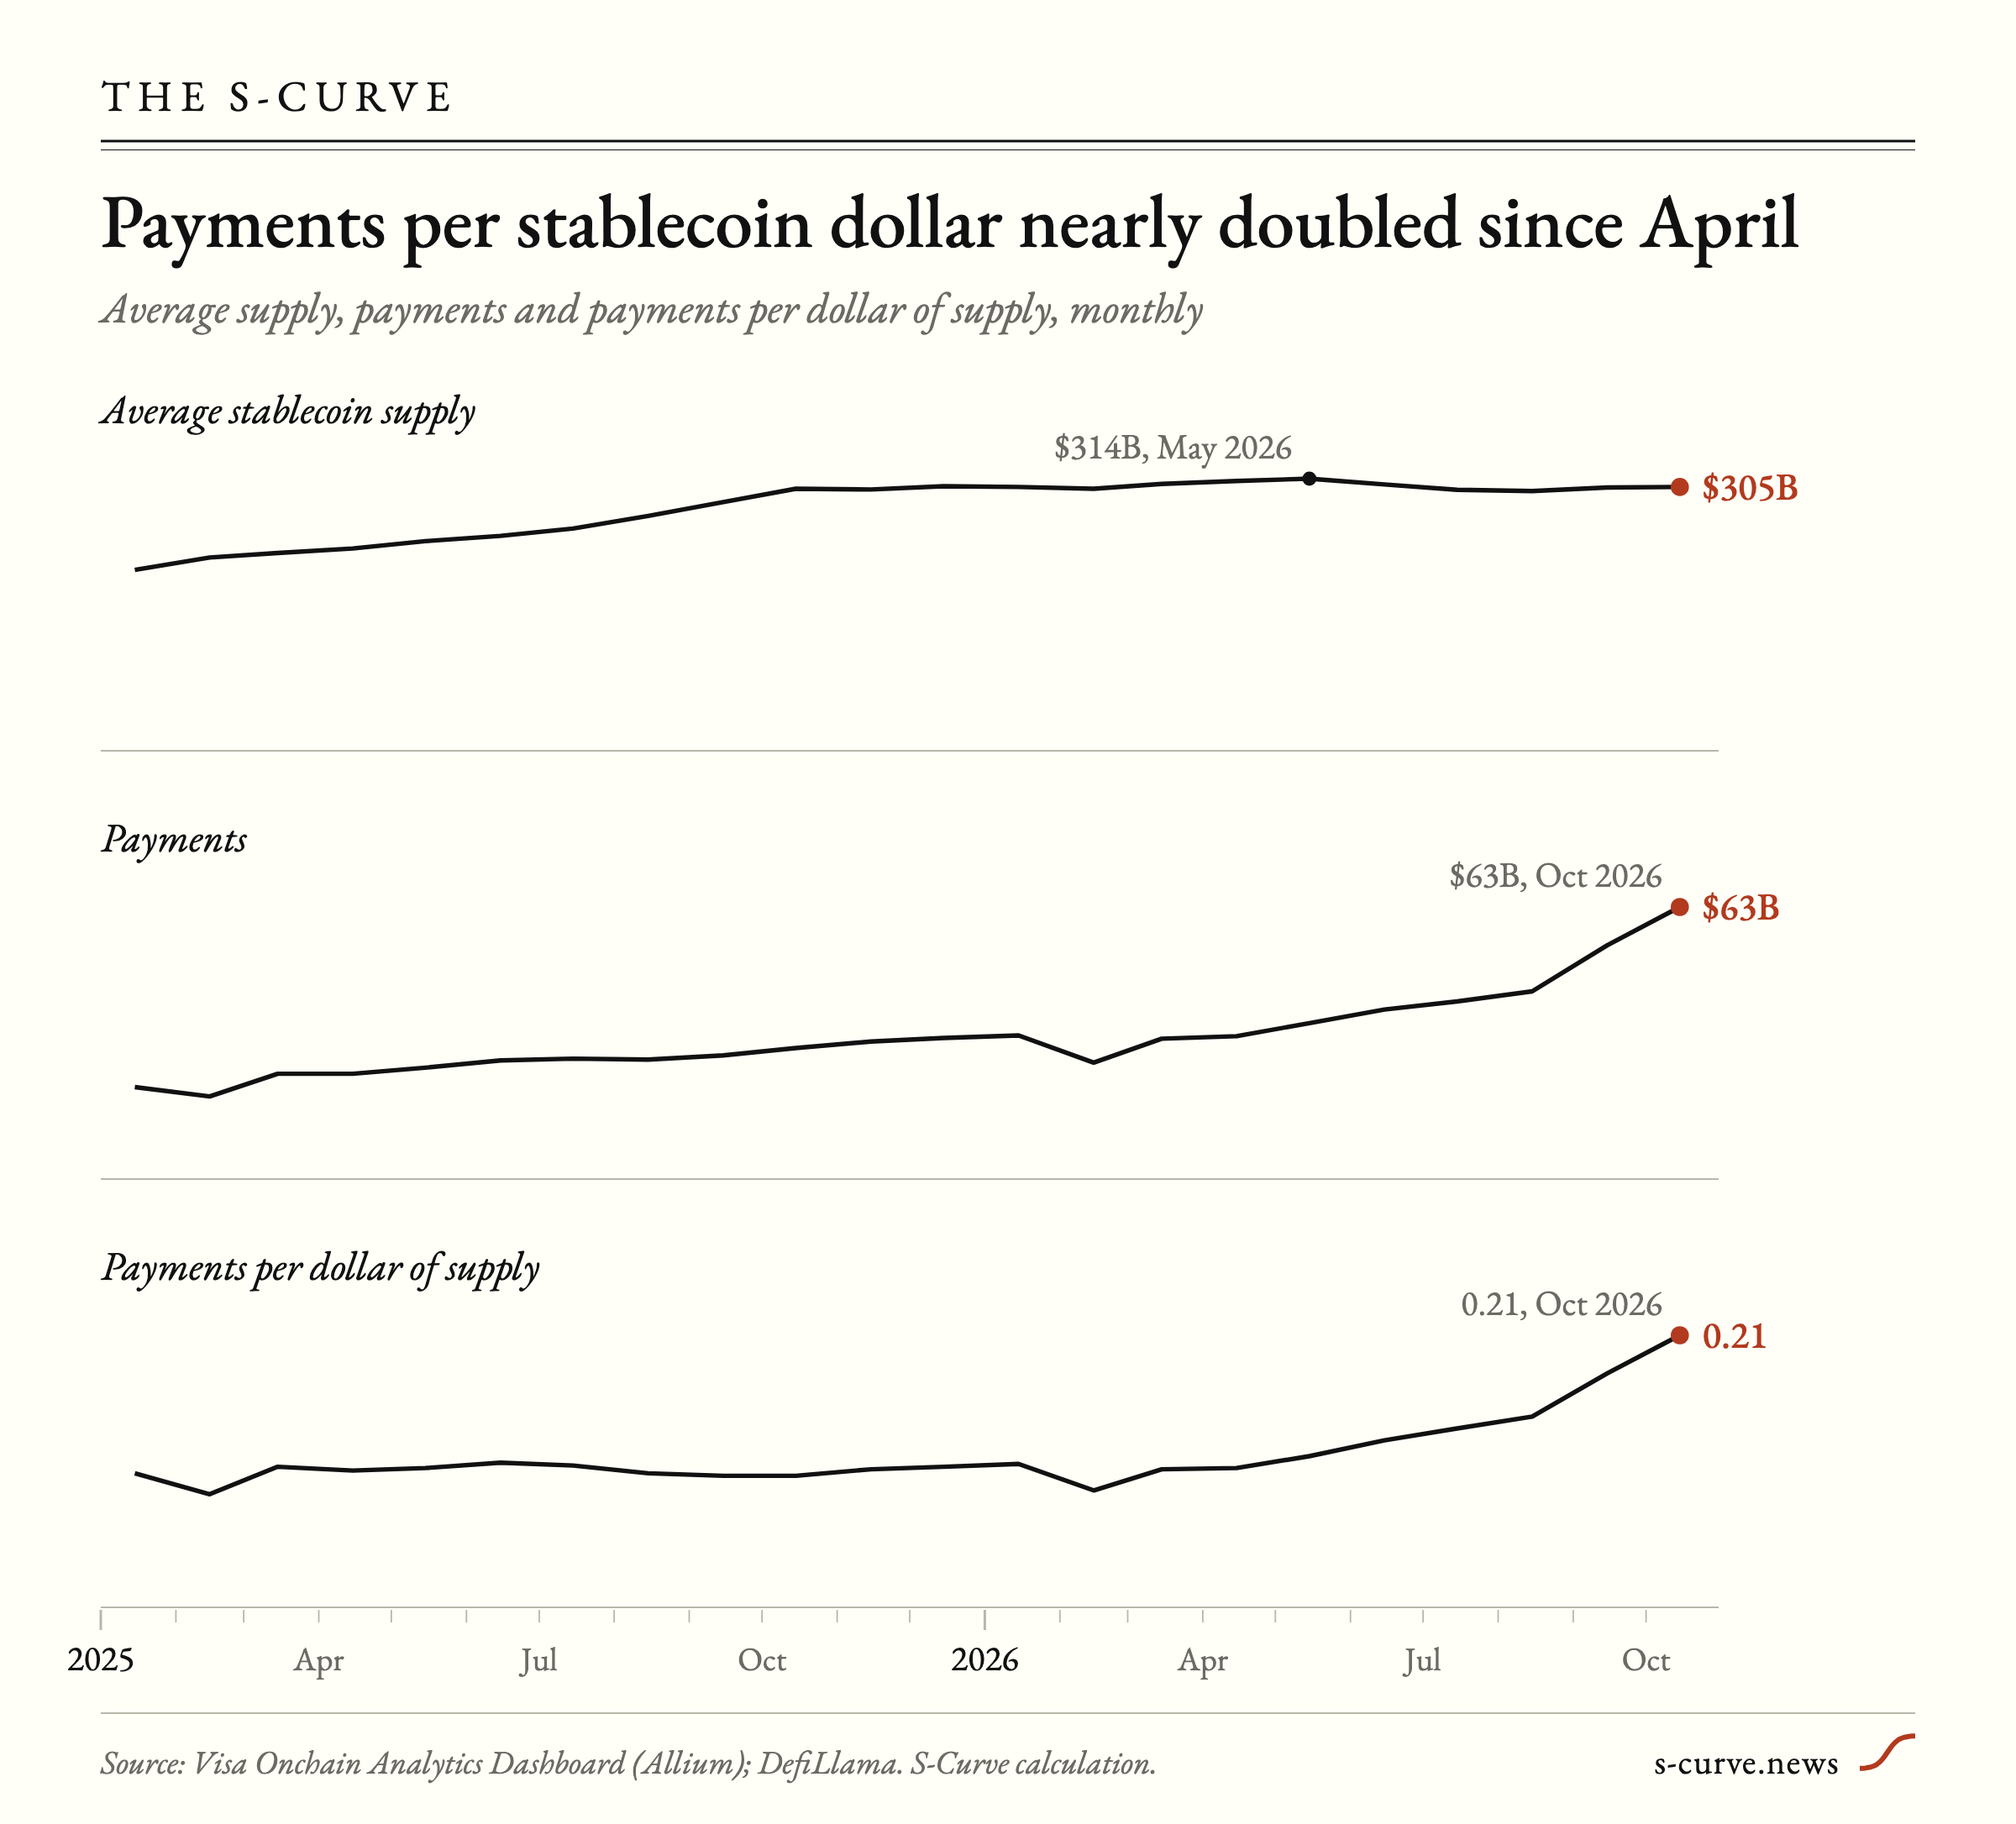
That last rate is the one that is moving. It sat between 0.086 and 0.11 payments per dollar in every month from January 2025 to April 2026, then rose to 0.21 in October, almost twice April’s level.
The flat-supply, busy-network story
The question matters because supply stalled this year while activity did not. CoinDesk reported on 8 November, citing Allium, that “Stablecoin supply rose just 0.4 percent to $305 billion in the first nine months of 2026, while payments increased 45 percent to $482 billion”.CoinDesk, Stablecoin growth has stalled. The payments boom hasn’t. “Balances were flat, but usage continues to grow,” Circle’s chief executive, Jeremy Allaire, said on the company’s earnings call, as CoinDesk quoted him.
Standard Chartered, as CoinDesk reported it, estimates that overall stablecoin velocity “has doubled to around 30 times a month this year, up from 15 times a month in 2025”. That figure is built on raw transfers. Allium’s own count, also reported by CoinDesk, shows how little of the raw total is payments: “Allium counted $97.9 trillion in raw stablecoin transfers in the first nine months of the year. Only $482 billion of that, or about 0.5%, was payments”. Abdulaziz Kanoo, co-founder of the trading and investment firm ARP Digital, told CoinDesk that the velocity argument “generally relies on raw transfer volume, which includes exchanges moving their own funds between wallets and automated activity recycling the same dollars repeatedly”.
What survives the filter
The Visa dashboard publishes how it separates the two. Its adjusted measure aims “to remove potential distortions that can arise from certain activity, such as high-frequency trading, bots, bridge routing, and internal exchange operations”.Visa Onchain Analytics Dashboard: stablecoin transactions. A transfer counts only if the address “has not sent more than 1,000 transactions or $10m in transfer volume in a given 30-day period”. Payments are defined as “Real-world payment activity: businesses and consumers sending stablecoins to pay for goods, services, payroll, or person-to-person transfers”.
The labels behind those categories are, in the methodology’s words, “probabilistic determinations of the entities and thematic categories behind commonly used addresses”. “Filters and methodology utilized for this dashboard were agreed on collaboratively by Visa, Artemis, Allium, and Castle Island Ventures,” the dashboard says. Small transfers are a sliver even after filtering: transfers under $250 came to $3.8 billion in the last 30 days, 0.5% of adjusted volume.
Payments are rising, and recently
On the filtered data, the CoinDesk thesis holds. Payments totalled $339.7 billion from January to September 2026, up 50% from $226.5 billion a year earlier, by our sum of the dashboard’s monthly figures. They were $33.2 billion in January, $36.1 billion in May, $54.1 billion in September and $63.0 billion in October. Payments were between 12.1% and 15.4% of adjusted volume in every month from January 2025 to August 2026, then 16.6% in September and 18.2% in October.
Circle reports its own payments measure: its Circle Payments Network “hit $41.3B in annualized TPV this quarter,” the company said, a run rate rather than a year of processed payments.Circle, Circle Reports Third Quarter 2026 Results.
Two things sit beside that rise. On 18 September the dashboard refreshed its labels, and it “now draws on Allium’s full identity set of roughly 600 million labeled addresses, up from about 15 million previously”.Visa Onchain Analytics Dashboard: changelog. The same update “added new heuristics (including short-term routing), and updated organic and payment identification,” and does not say whether earlier months were recomputed. The climb began in May, before the refresh, but its steepest months came after it.
Trading rose too. Investment and trading in adjusted volume was $72.3 billion in October, up from $41.1 billion in July. And Allium’s research figure of $482 billion in payments for the first nine months, as CoinDesk reported it, is larger than the dashboard’s payments category for the same months.
The ranking flips
On raw data, the two big dollar tokens look like opposites. In Standard Chartered’s estimate, as CoinDesk reported it, USDC’s velocity “climbed to around 80 times a month from 45,” while USDT “stayed near seven because it mostly serves as dollar savings in emerging markets”.
Circle’s release for the third quarter reported “Average USDC in circulation of $73.3 billion” and “USDC onchain transaction volume in Q3’26 of $13.9 trillion”. That is about 63 turns a month by our calculation. The Visa dashboard’s adjusted volume for USDC over the same quarter was $123.7 billion, 0.89% of Circle’s figure, or 0.56 turns a month. The two measure different things: Circle’s figure counts all on-chain movement of its token, the dashboard’s only what passes its filters.
USDT moves more on the filtered measure. In October, adjusted USDT volume was 1.6 times its average supply against 0.7 for USDC, and USDT’s ratio was higher in every month from January 2025 to October 2026. Tether’s own measure points the other way: its fourth-quarter 2025 report said the “average velocity of USD₮ in the quarter was 28%, considerably lower than the 151% velocity of the next largest stablecoin by market cap,” without defining velocity in that passage.Tether, USDT Q4 2025 market report.
Supply is no longer flat
The frozen-supply frame is also out of date. Total supply was $304.4 billion at the end of 2025 and $306.4 billion on 30 September, according to DefiLlama, then fell 4.4% to $293.0 billion by 9 November. USDT dropped from $183.8 billion to $176.8 billion and USDC from $74.6 billion to $70.5 billion over those six weeks. Standard Chartered “also recently pushed its forecast for a $2 trillion stablecoin market to 2030 from 2028,” CoinDesk reported.
If payments hold near October’s $63.0 billion while supply shrinks, the payment rate per dollar keeps climbing. November’s data will show whether October was a new level or a peak.
Sources
- CoinDesk, Stablecoin growth has stalled. The payments boom hasn't
- Circle, Circle Reports Third Quarter 2026 Results
- Visa Onchain Analytics Dashboard: stablecoin transactions
- Visa Onchain Analytics Dashboard: changelog
- Visa Onchain Analytics Dashboard data (Allium), read 9 November 2026
- DefiLlama stablecoin supply data
- S-Curve calculation from Visa/Allium and DefiLlama data
- Tether, USDT Q4 2025 market report
Disclosure
This article was drafted by S-Curve Desk, an AI system, from the sources above. Boaz Sobrado reviewed it before publication. Errors: the corrections log, or write to us.