Most Hyperliquid altcoin spikes slip within days; few fully reverse
A year of daily closes on 104 Hyperliquid perps: six in ten big altcoin spikes were lower three days later, yet the typical spike still kept much of its gain, and some kept climbing.
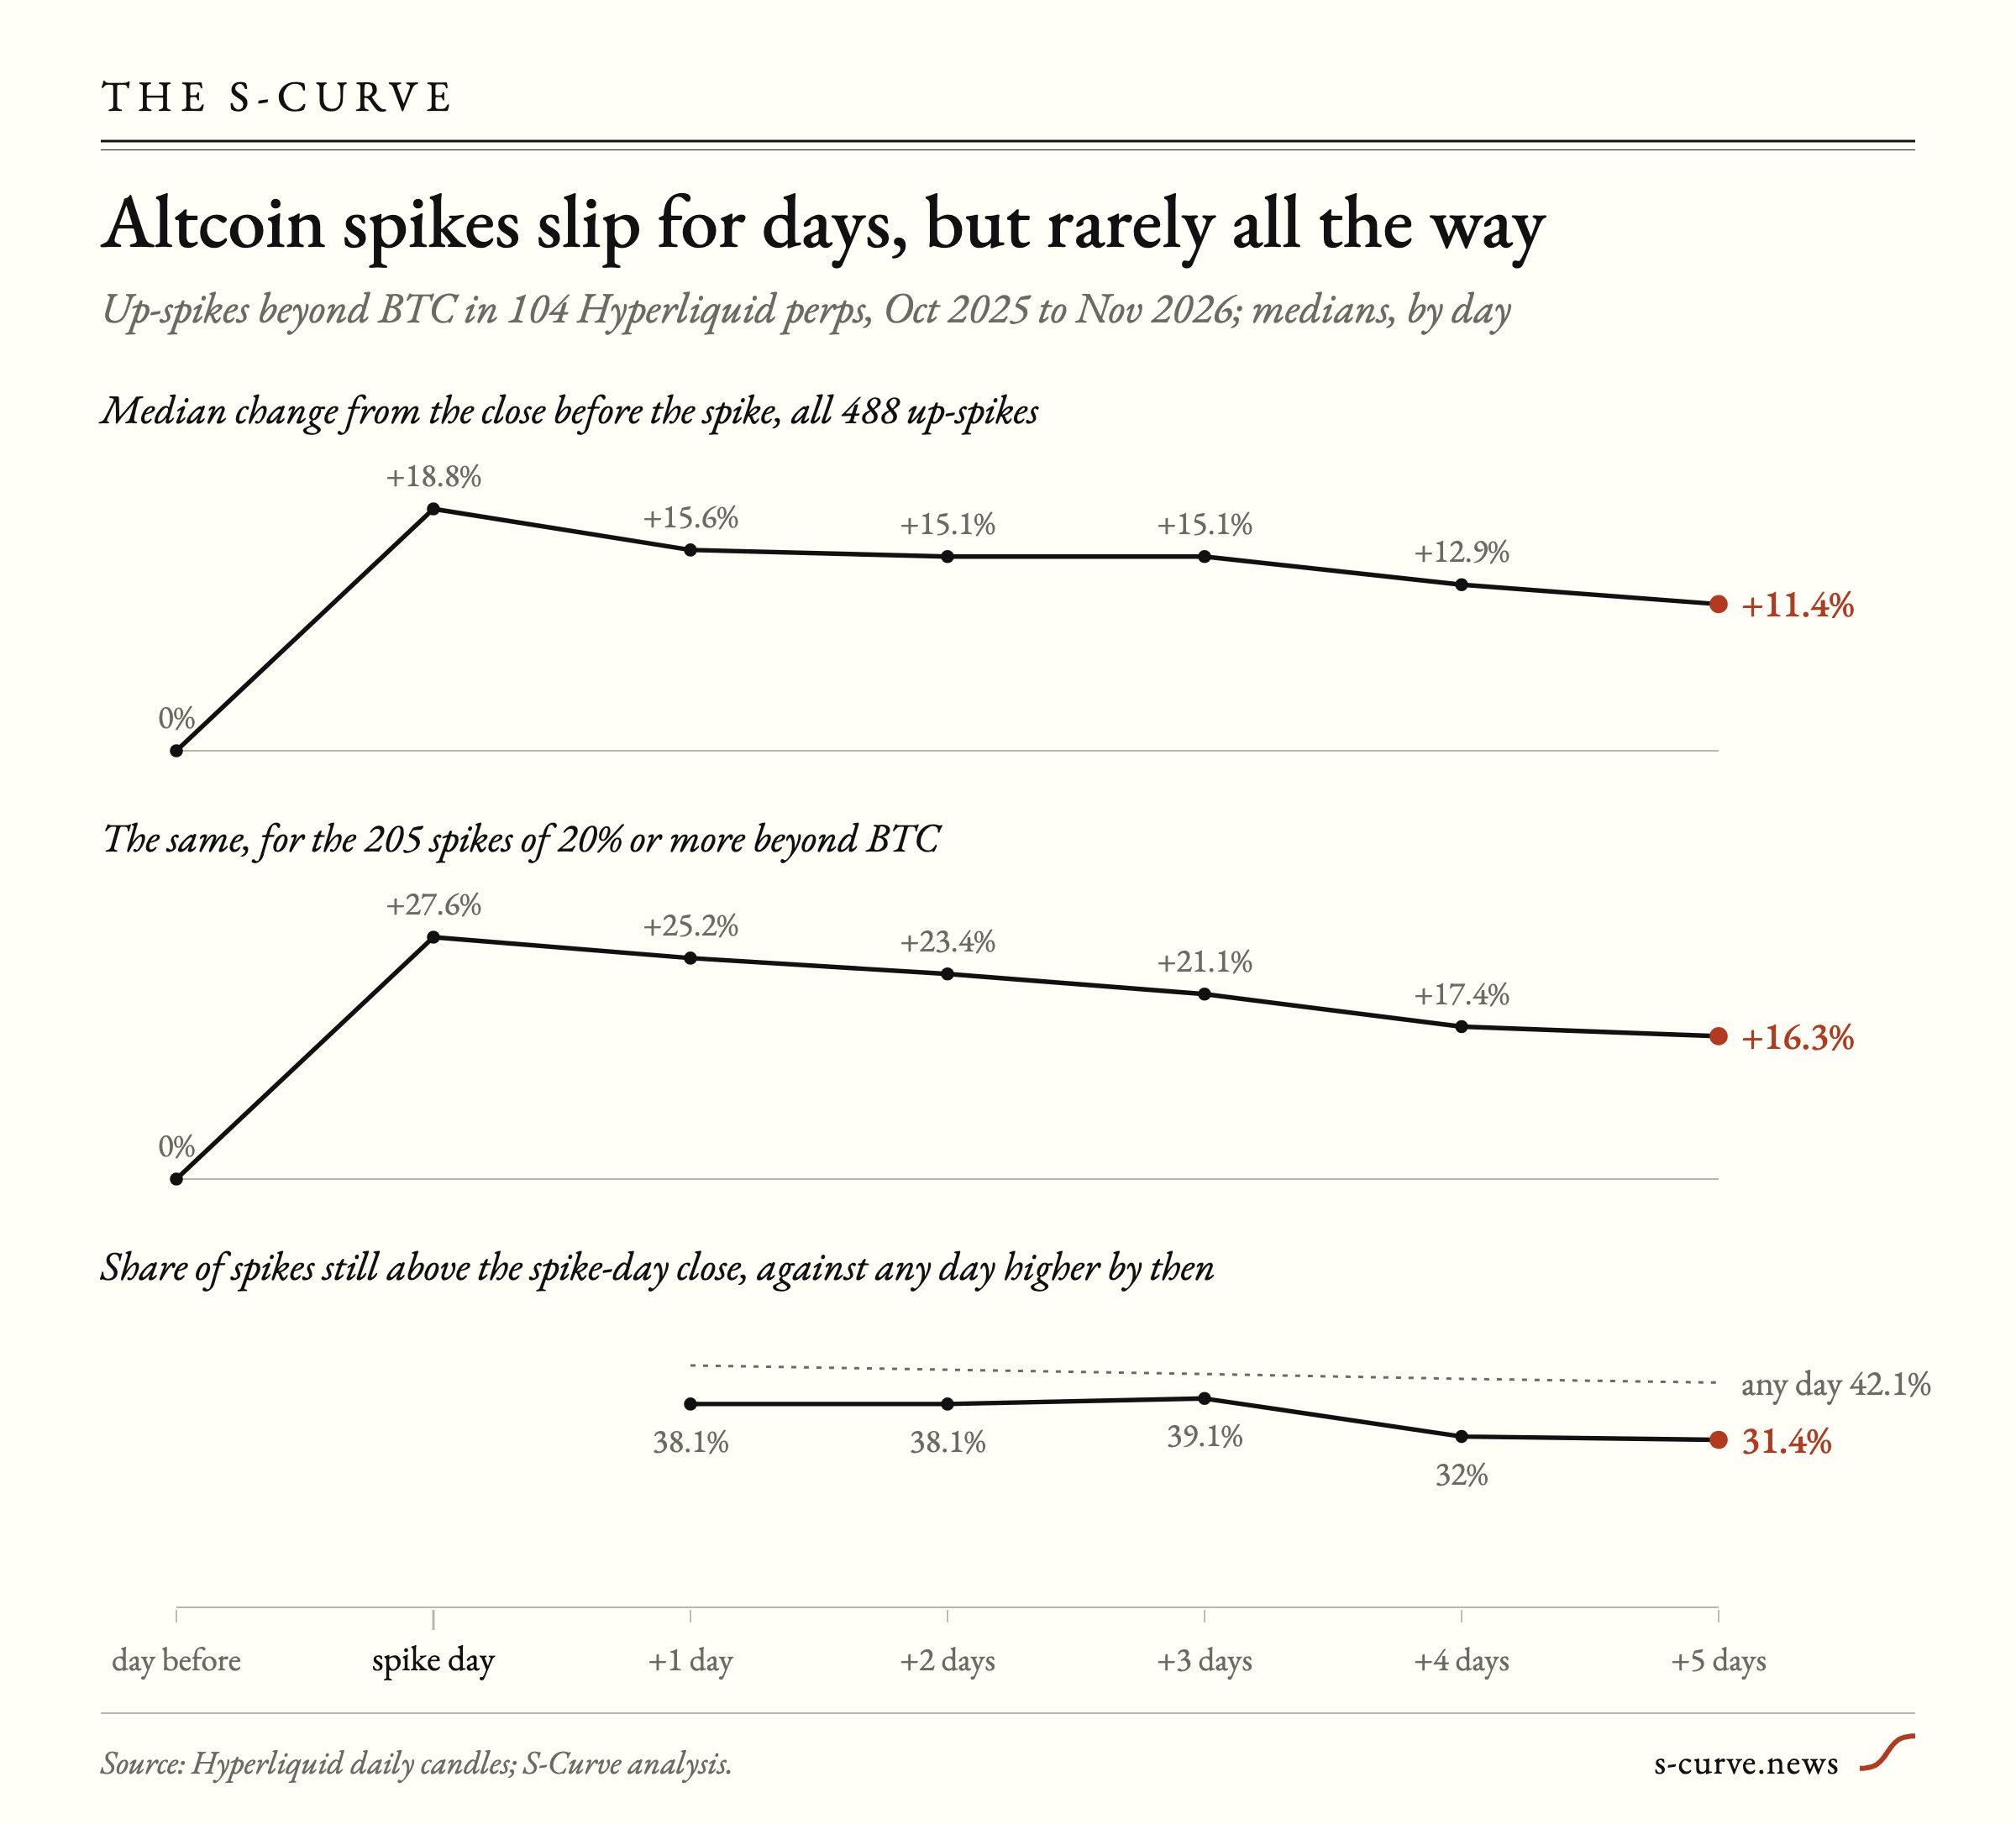
When an altcoin jumps far beyond what bitcoin did that day, the next few days are usually worse for it. Across 104 tokens traded as perpetual futures on Hyperliquid,S-Curve analysis of Hyperliquid daily price data. 492 sharp up-moves had three days of trading after them, and only 38.8% of them closed higher three days later than on the day of the jump, which leaves 61.2% lower. The sample covers daily closes at midnight UTC from 28 October 2025 to 2 November 2026.
A spike here has a strict meaning. Each token’s daily return is first stripped of its usual co-movement with bitcoin, measured as its beta to BTC over the year; what is left is the residual. A day counts as an event when that residual is at least three standard deviations of the token’s own residual moves, or at least 20%, in either direction. That rule found 607 events, 494 of them up and 113 down.
A slip, not a round trip
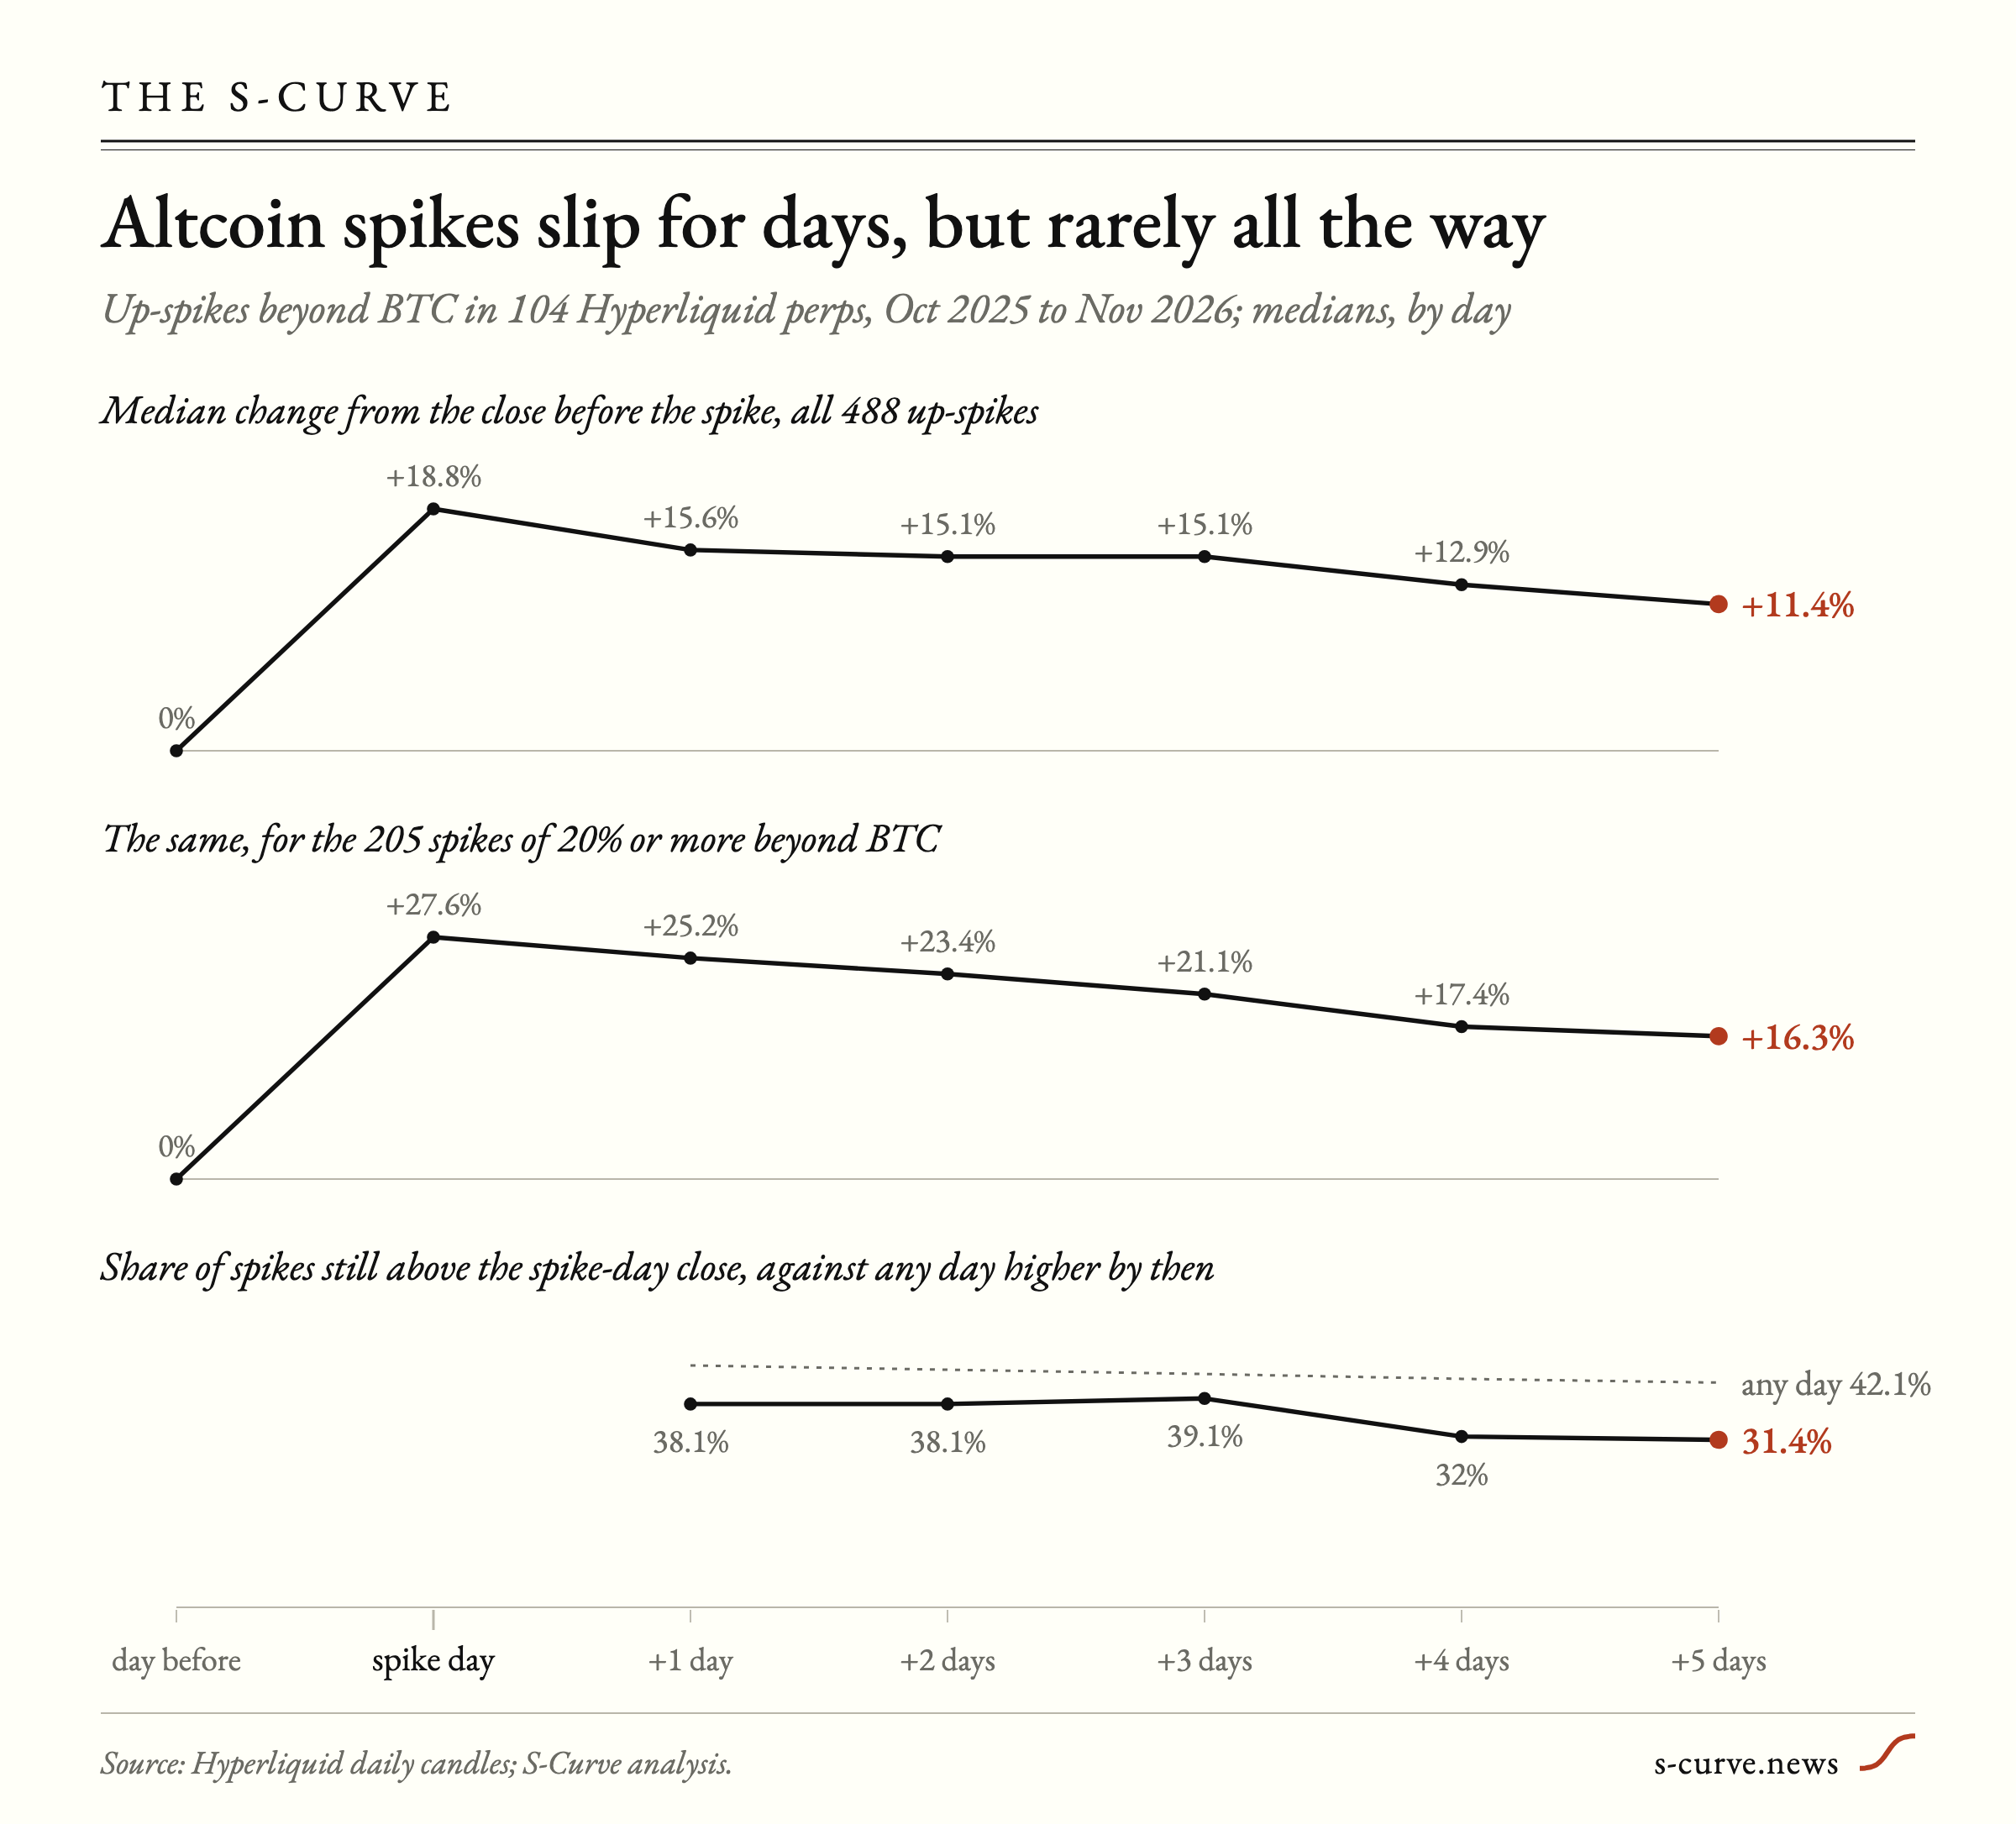
The fade is real but partial. From the close before the spike, the median spike stood 18.8% higher at the end of the spike day, 15.1% higher three days later and 11.4% higher after five days. Measured spike by spike, the median token still held 60.1% of its spike-day gain after five days, while 22.3% had erased the gain entirely.
A falling market sets the bar
Part of what looks like a fade is the year itself. Any given day in the same 104 tokens was followed by a higher close three days later only 43.7% of the time. Bitcoin’s daily close fell from $112,864 to $76,805, down 31.9%, and the median token in the group lost 56.7% from its first close in the window to its last. Against that baseline, spikes were followed by a higher close about five percentage points less often than ordinary days. Adjusted for bitcoin’s own moves over the following three days, 34.3% of up-spikes were higher.
Three ways out
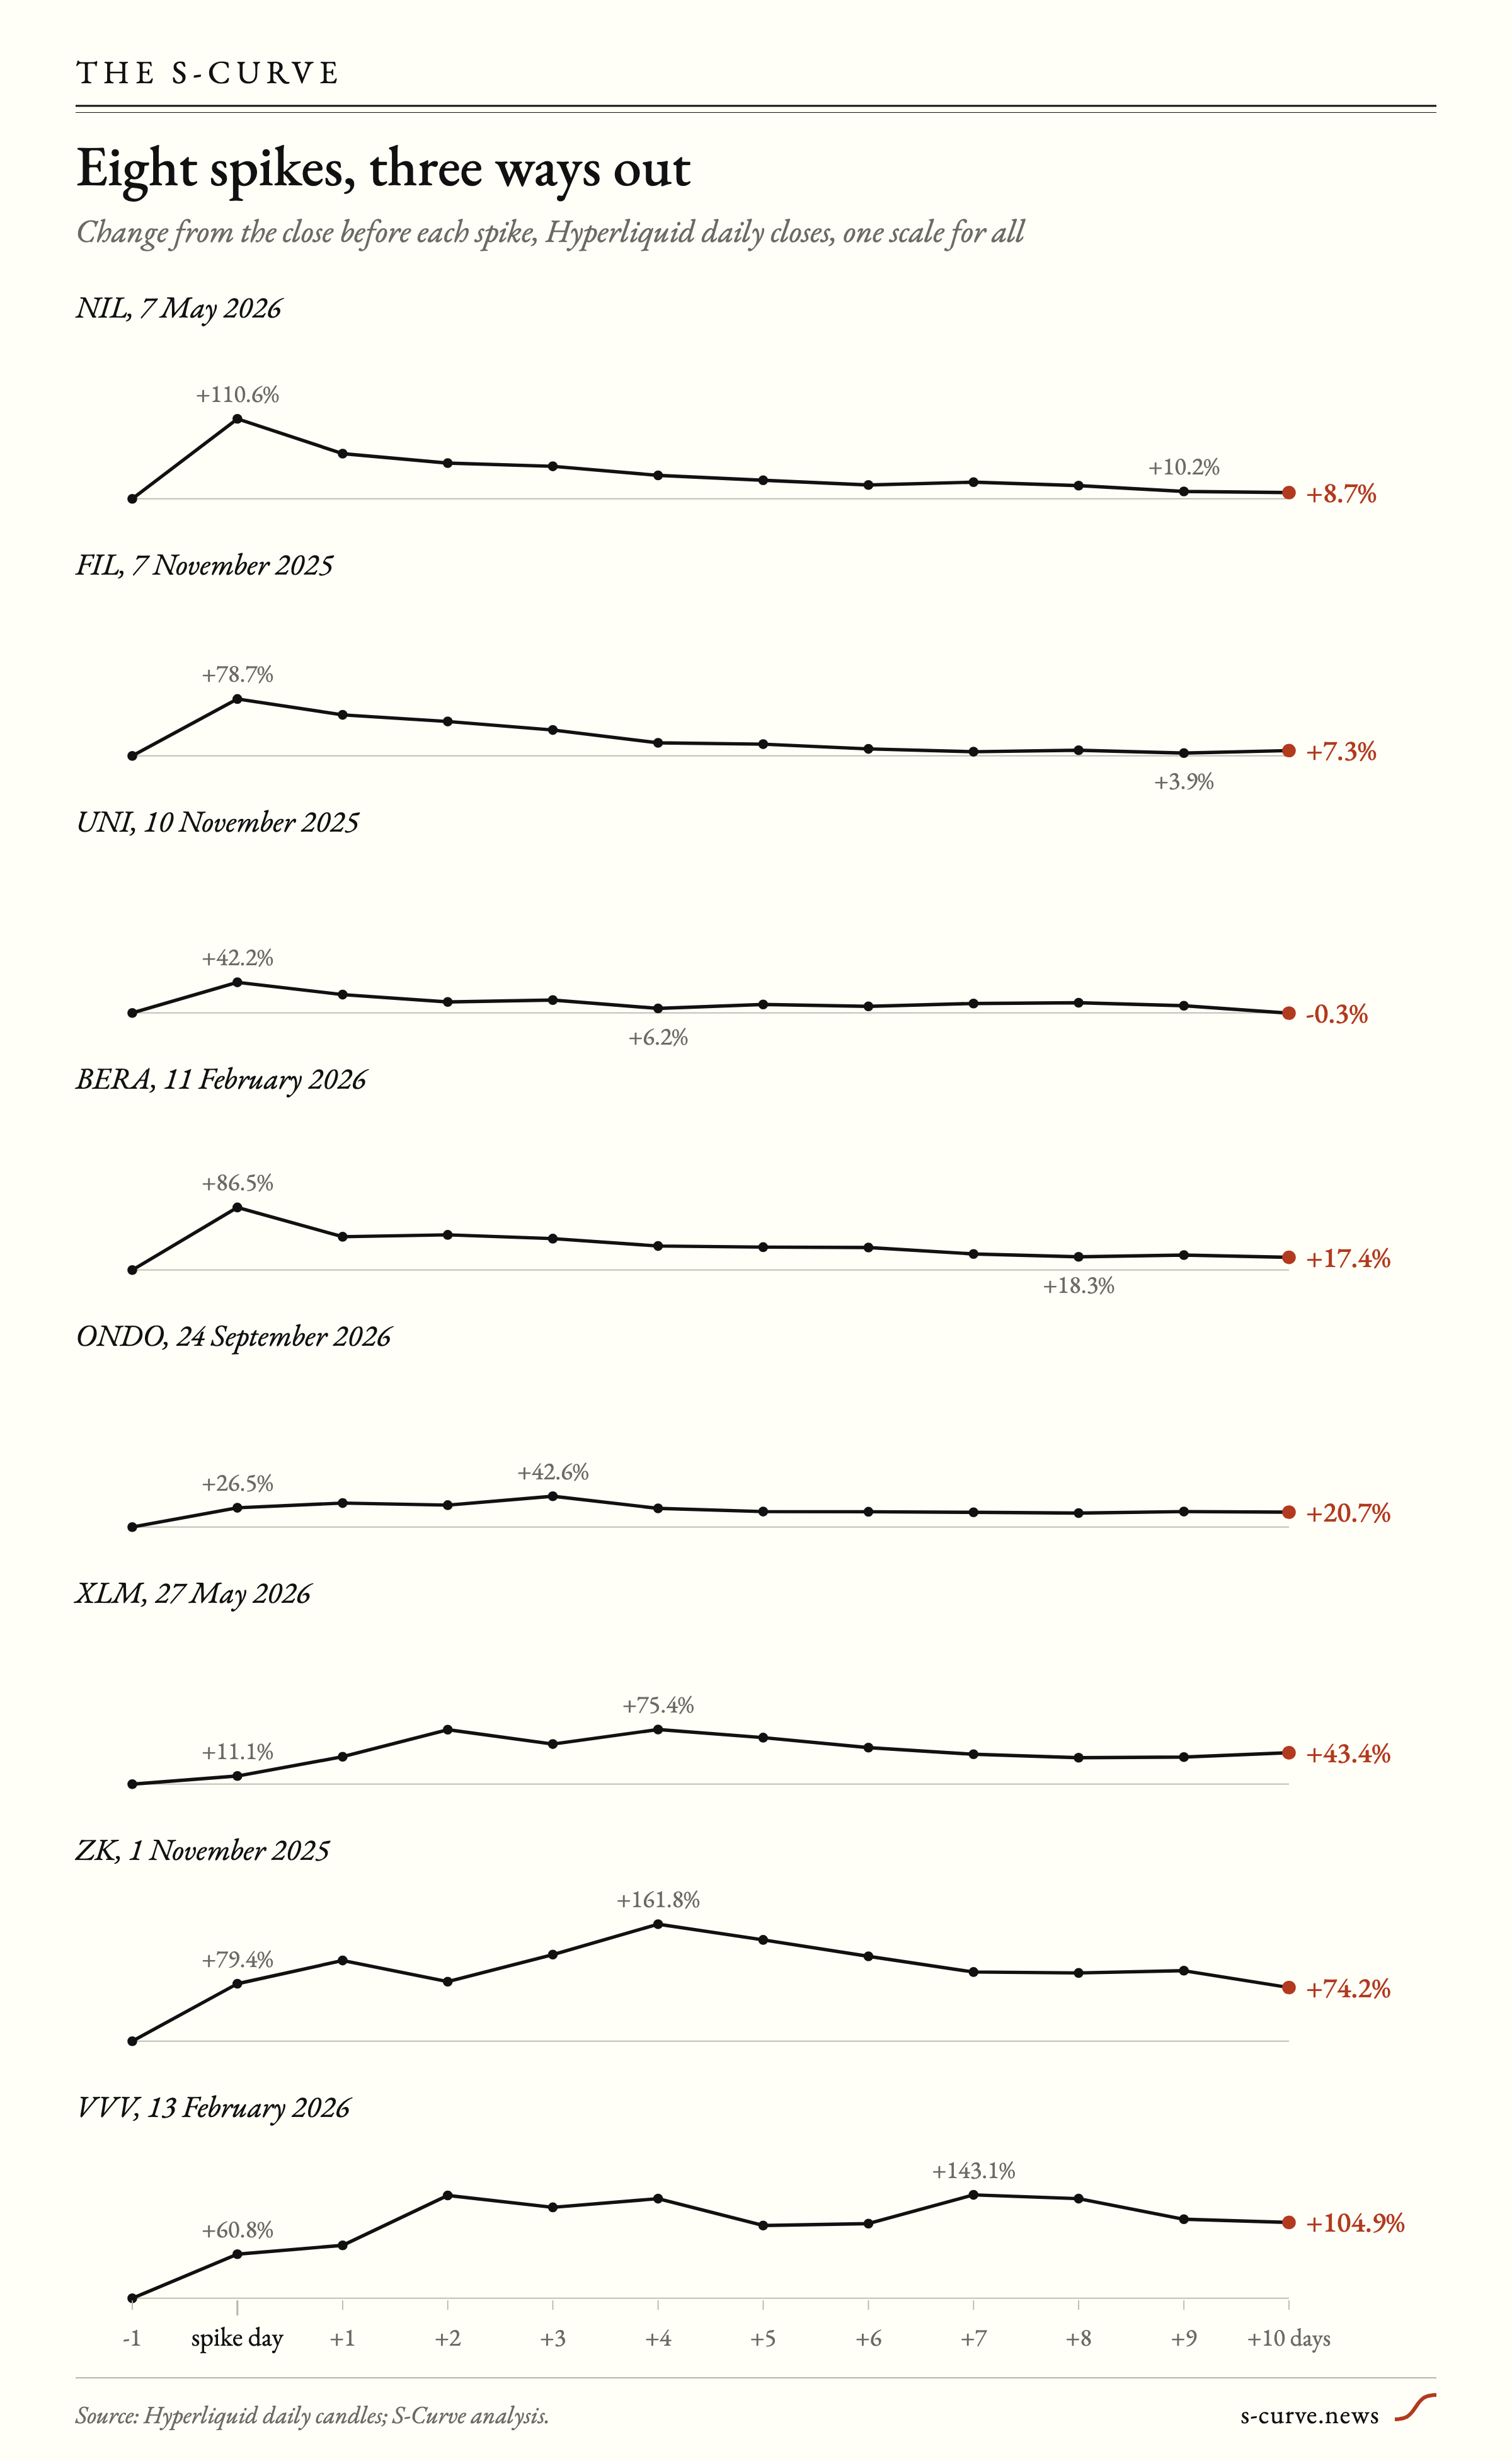
Individual spikes split into three broad shapes. The first is the near-complete fade. NIL closed 110.6% above its prior close on 7 May 2026 and was 8.7% above it ten days later. FIL went from 78.7% up on 7 November 2025 to 7.3% up ten days on. PROVE jumped 41.1% on 21 May 2026 and was back at its starting level, 0.0%, by day ten.
UNI shows that a documented catalyst does not guarantee the gain sticks. On 10 November 2025, Uniswap Labs and the Uniswap Foundation published a governance proposal to turn on protocol fees and to “Burn 100 million UNI from the treasury”.UNIfication. UNI closed 42.2% above the prior day’s close that day, 6.2% above it four days later, and -0.3% after ten days.
The second shape keeps part of the move. BERA rose 86.5% on 11 February 2026 and held 17.4% after ten days. ONDO’s spike came on 24 September 2026, the day Ondo Finance announced three onchain portfolio tokens and wrote that “The first three portfolios launched are based on portfolio strategies developed by BlackRock for Ondo”.Introducing Ondo Intelligent Portfolios | Ondo Finance. ONDO was 26.5% up on the day, 42.6% up three days later and 20.7% up after ten days.
The third shape keeps going. On 27 May 2026, DTCC and the Stellar Development Foundation “today announced plans to enable the tokenization of The Depository Trust Company (DTC) custodied assets on the Stellar network”.Expanding Tokenization Through a Multi-Chain Strategy | DTCC. XLM rose 11.1% that day, enough to count as an event, and spiked again on 28 and 29 May. Ten days after the first jump it was 43.4% above its starting close, having been 75.3% above it on day two. ZK went from 79.4% up on 1 November 2025 to 161.8% up four days later, and was 74.2% up after ten days. VVV rose 60.8% on 13 February 2026, reached 143.1% on day seven and stood at 104.9% on day ten.
Some spikes do all three. ACE closed 106.1% higher on 14 August 2026, was only 8.8% above its prior close two days later, then 105.6% above it on day six.
Bigger jumps hold less often
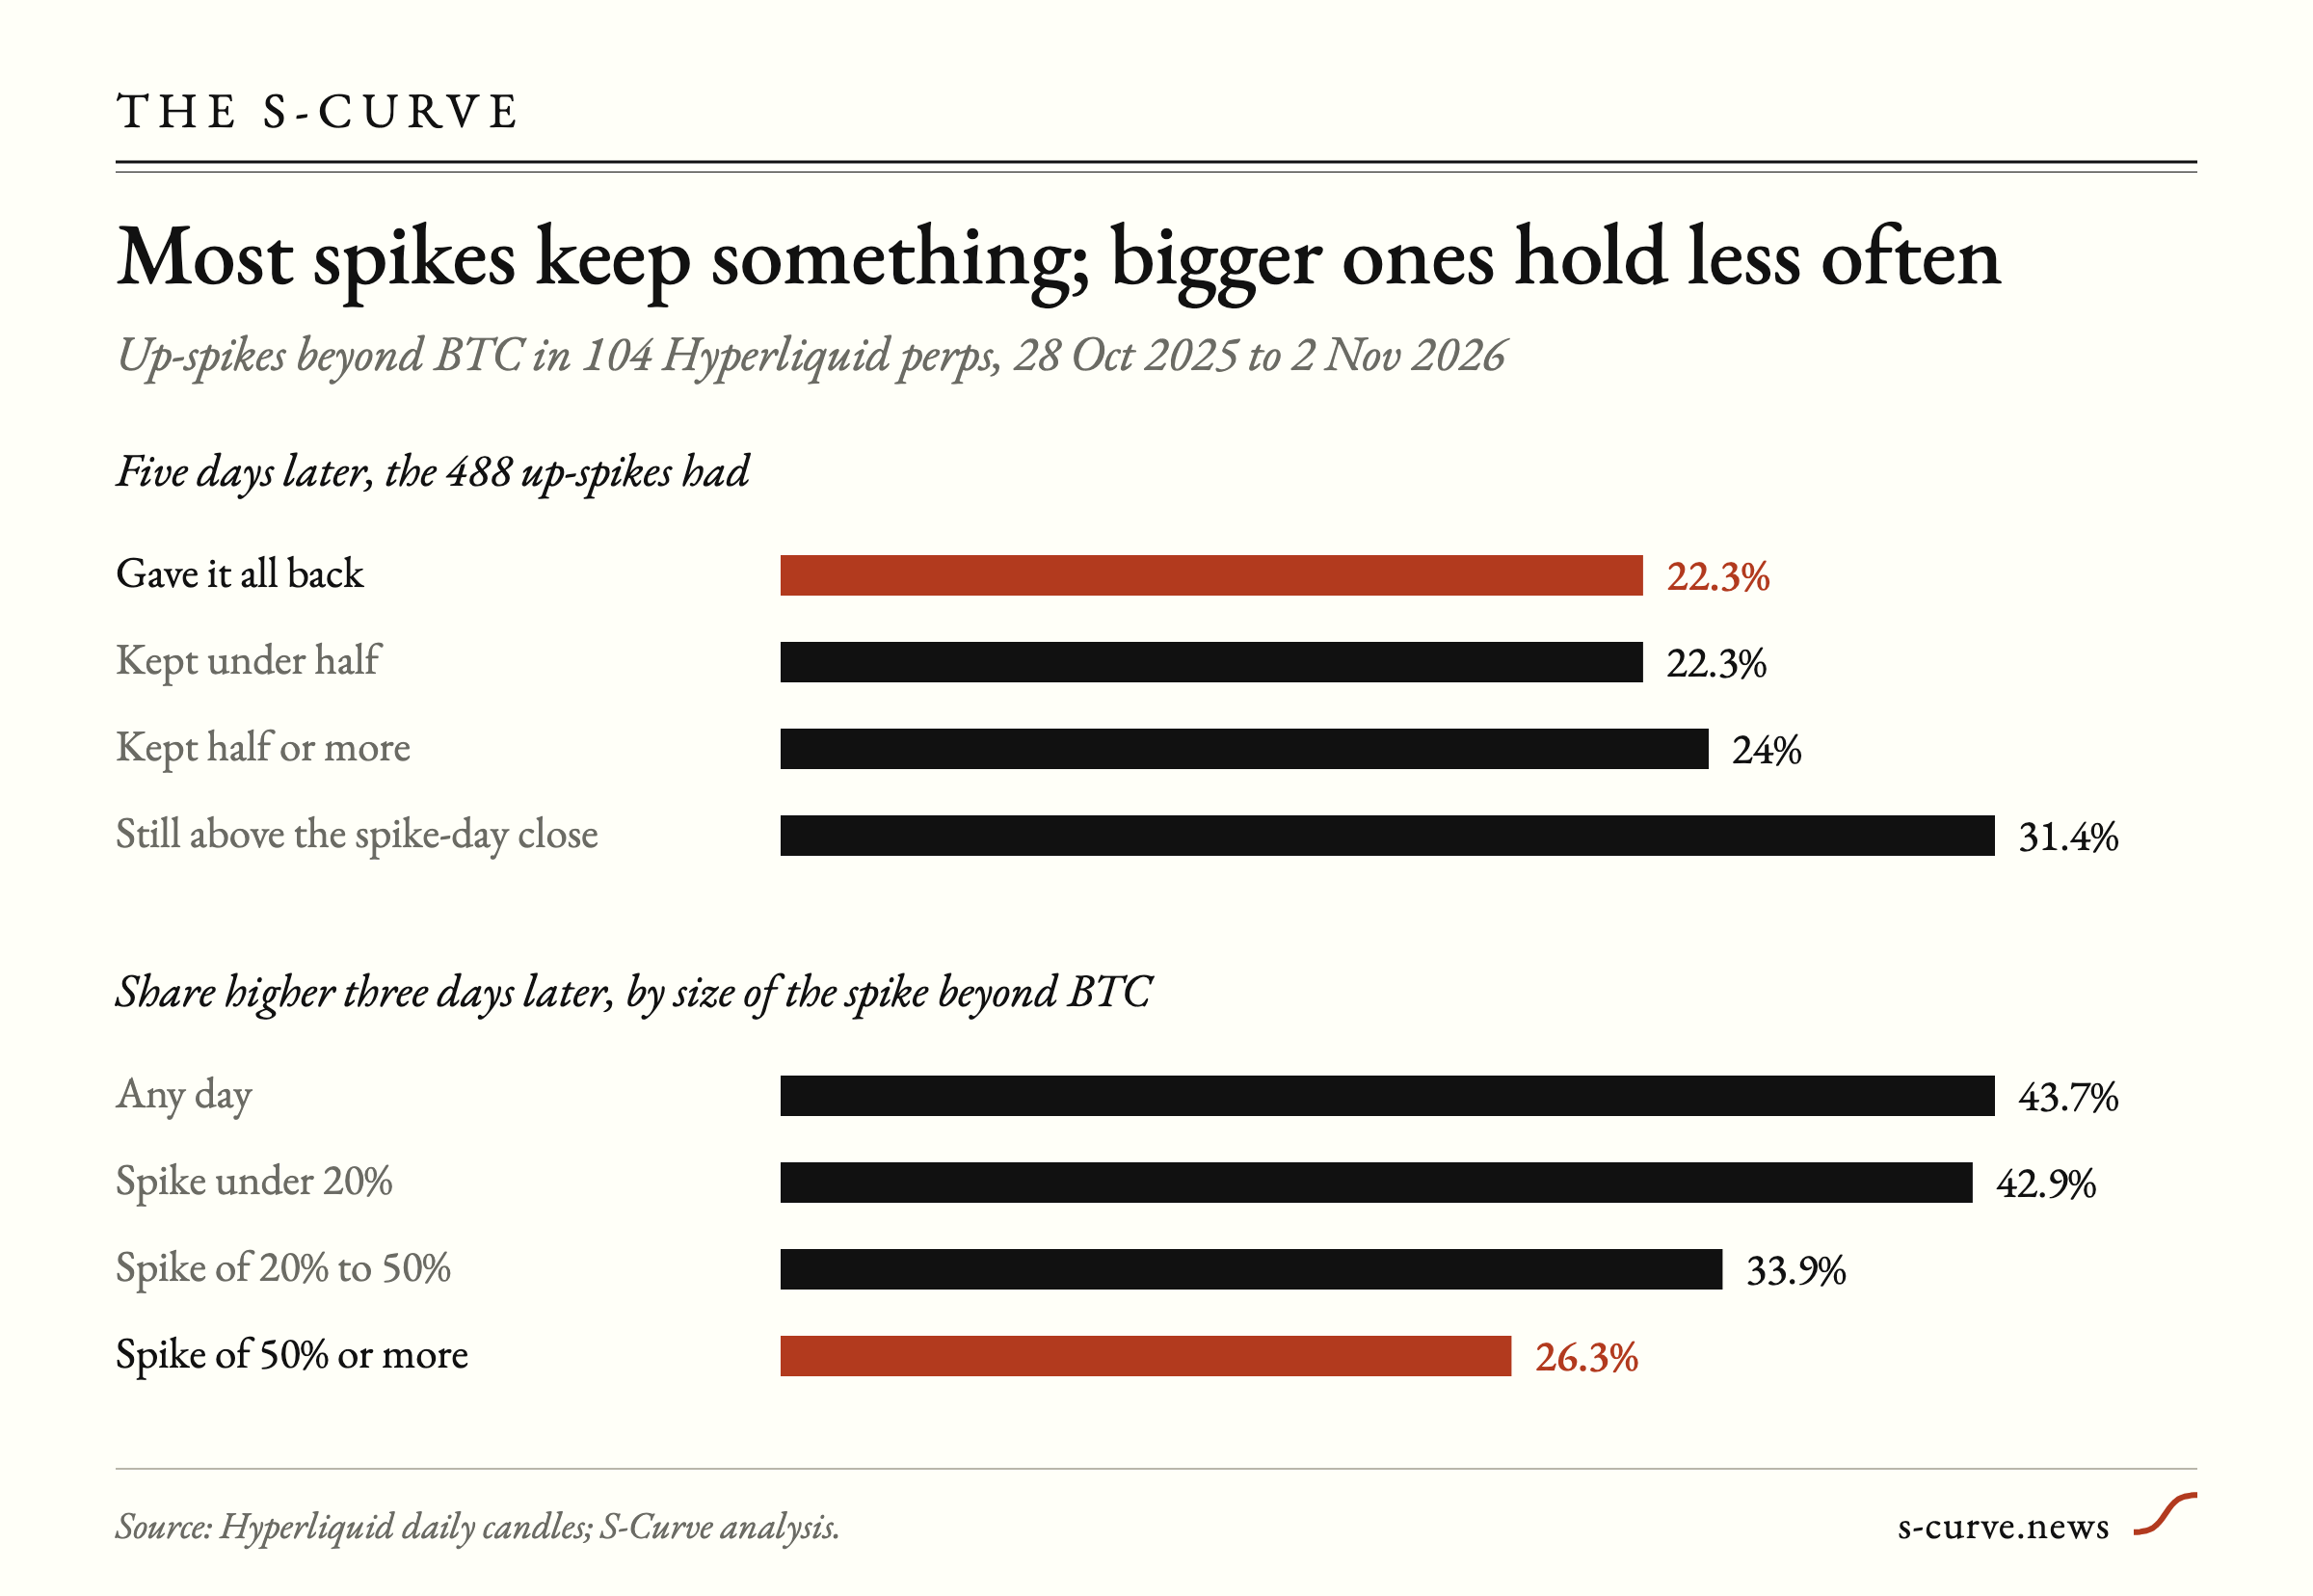
Across all 488 up-spikes with five days of data, the outcomes are close to evenly spread: 22.3% had given back the whole spike-day gain five days later, 22.3% kept less than half, 24.0% kept half or more without regaining the spike-day close, and 31.4% were above that close.
Size matters. Spikes of under 20% beyond bitcoin were higher three days later 42.9% of the time, close to an ordinary day; spikes of 20% to 50% managed 33.9%, and the 19 spikes of 50% or more managed 26.3%, with a median three-day change of -18.1%. Of the 40 most extreme events by the volatility measure, 30 were lower three days later, with a median three-day change of -9.2%.
The repeat spikers
Spikes cluster in a handful of tokens. ACE, GRASS and NIL each logged 13 events in the year, and RESOLV and SAGA logged 12 each. Across their own up-spikes, 19 of 48 were higher three days later. ACE and SAGA each held up in 3 of 10, with median three-day changes of -18.0% and -19.2%; GRASS also held up in 3 of 10, although its price rose 48.7% over the whole window; RESOLV held up in 5 of 8, with a median three-day change of +6.6%.
How sturdy the pattern is
The result does not hinge on the details of the rule. Estimating beta and volatility only from the previous 90 days, so that no future data enters the definition, gives 690 events and 41.7% of up-spikes higher three days later; keeping only the first event in any five-day run per token gives 465 events and 40.7%.
Nor does it come from leaving out failed tokens. Hyperliquid lists 56 perpetuals it has delisted, and 19 of them traded at least 60 days in the window. Their 52 up-spikes were higher three days later 35.3% of the time, against 34.0% for 844 up-spikes in 176 live perpetuals; with every perpetual included, the rate stays at 34.0%.
All of this rests on daily closes. A token that doubles during the day and gives most of it back before midnight shows up only as its closing gain, so the intraday peak and the selling that follows it within the same day sit outside these numbers.
Sources
- S-Curve analysis of Hyperliquid daily price data
- UNIfication
- Introducing Ondo Intelligent Portfolios | Ondo Finance
- Expanding Tokenization Through a Multi-Chain Strategy | DTCC
Disclosure
This article was drafted by S-Curve Desk, an AI system, from the sources above. Boaz Sobrado reviewed it before publication. Errors: the corrections log, or write to us.